The New York Breakout strategy is traded within the first hours of the New York forex time zone. It is meant to catch any big moves that occur between 1 pm and 3 pm GMT. The principle behind this strategy is to trade in the direction of where the market players push the currency pair once the overlap period between the London and New York time zones occur. Just before the New York session opens, the London session would have thinned out to some extent and traders who would have woken up to trade during the New York session would be looking to capitalize on any market events worth profiting from.
Indicators
The original strategy as described is uses two custom indicators which are freely available for download online.
- ant-GUBreakout. The original version is v 0.4.1. As at 2014, version 0.4.2, optimized for use on the new MT4 Build 600 platforms has been released. A Google search will reveal the source where you can download this indicator.
- iParamonWorkTime indicator.
- Color-coded MACD histogram (optional).
Currencies
Since this strategy is to be traded in the first two hours of the New York market session when it overlaps with the London session, only currency pairs which are actively traded during this session should be used. The Asian currency pairs of AUDUSD, AUDJPY, NZDUSD and NZDJPY should be avoided.
Strategy
This is how to implement the strategy.
Step 1: This strategy is traded on the 15 minute chart.
Step 2: You must determine the GMT shift of your platform. That is, determine by how many hours your platform’s time differs from the Greenwich Mean Time (on which the strategy is based). Pull you computer cursor to the top of the most current candle on the 15 minute chart to see the pop-up that will appear. This pop-up displays the High, Low, Open and Closing prices for the candle, and also shows the current time. If the platform’s time is the same as GMT, your GMT shift is 0. If the platform’s time is one hour behind, the GMT shift is -1. Get the drift?
Step 3: Open the iParamonWorkTime indicator, and click the Inputs tab. This shows the indicator’s parameters. Look for “Begin2/End2” and adjust the times there using the GMT shift. The platform used in this example has a GMT shift of 0, so the time is set to 1300 and 1500hrs (i.e. 1pm and 3pm) respectively.
Once the two indicators have been attached to the chart, two vertical grid lines with a shaded area will delineate the 1pm GMT to 3pm GMT time zone, two horizontal lines will also delineate the highest and lowest candlestick points that are located between the vertical grid lines. You can adjust the text colour as well as the colour of the shaded area for better visualization.
Long Trade
The long trade setup is to trade the breakout of the upper horizontal trend line drawn by the ant_GU Breakout indicator. Allow the price action to breakout of the trendline and then trade with a profit target of 40 to 50 pips, while setting a tight stop loss of 10 pips, set just below the broken trend line. The principle is to allow the price to pull back to the the upper trend line after a candle has closed above it, and then take the trade using either a Buy Limit or a Market Buy order. Usually the indicator will also show you the exact price at which the trend line rests, giving you a very precise entry.
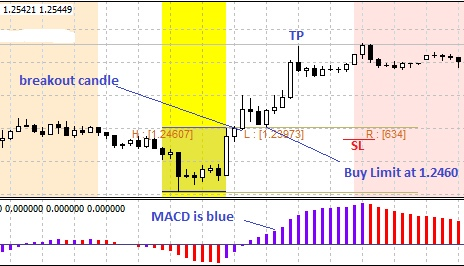
The yellow shaded area is our area of interest. We can also see the trend lines and grid lines drawn by both indicators. The breakout candle is seen and the pullback is also seen to occur at the same time that the MACD histogram is blue in colour. This opened the door for a long trade on the EURUSD, which actually moved a distance of 100 pips on the same day.
Short Trade
The short trade is taken in reverse. Here, we look to trade the breakout of the lower trend line demarcated by the ant_GU Breakout indicator. We see this clearly shown on the snapshot below:
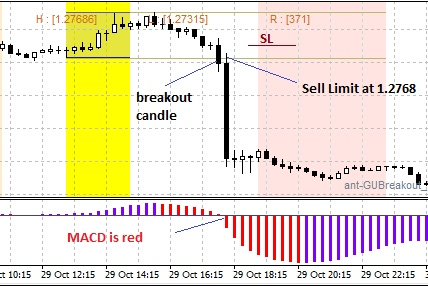
The breakout is seen, and the long black candle which followed opened with a pull back to the lower trend line before taking off on a long journey down south, producing a move of close to 150 pips. At the same time, the MACD histogram showed a red colour, which supported the bearish bias for the move.
This strategy is very simple to implement and can be used to pick a lot of pips from the market month after month. Test it out on demo before applying it to a real money account.